4th Jul 2013 | Horse Racing
Sandown Draw Bias: 5f

We examine the draw bias on Sandown’s 5f track.
Track: Sandown
Distance: 5f
Stalls: Low
Summary: Advantage being drawn low.
Moving Average: Actual v Expected wins (2008 to 2012)
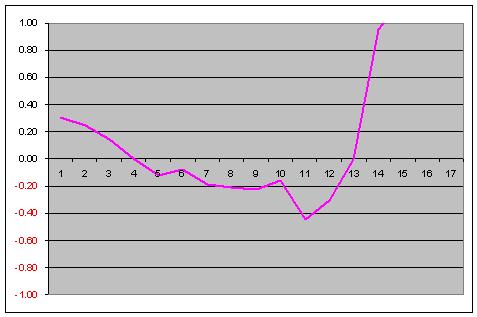
Graph depicts number of actual wins above or below expected number of wins, when taking into account bookmaker margin. E.g. If a horse raced 10 times from stall one, each time with an SP of 9/1, you would expect 1 winner and the difference between actual & expected wins = 0
To get around the problem of a small sample size, I have used a moving average. This groups together adjacent stalls (two either side) as a block.
Conclusion: The three lowest stalls enjoy a big advantage over the rest of the field and have the benefit of racing against the rail. The wider you are drawn the harder it is to win. The spike around stall 14 is an anomaly because of a small sample size.
Odds correct at time of publishing: 10:06 4th Jul, 2013 but subject to change